
Interval coverage
Heatmap that layers forecast vs. staffing every hour to highlight CX adjustments.
Data analyst focused on CX and WFM. I design executive dashboards and forecasting processes, integrating Python / SQL / Power BI / Looker Studio to answer business questions and prioritize actions.


Sample reports covering interval coverage, proactive alerts and channel productivity.
Heatmap that layers forecast vs. staffing every hour to highlight CX adjustments.

Control tower view combining backlog, SLA and capacity to trigger preventive playbooks.

Comparative report aligning interactions, staffing and experience across CX channels.
Business-oriented data analyst. I connect forecasting, dashboards and automation so operations can decide fast.
I partner with CX/WFM teams and business functions to align capacity, demand and follow-up.
Recent collaborations connecting forecasting, executive dashboards and automation for CX.
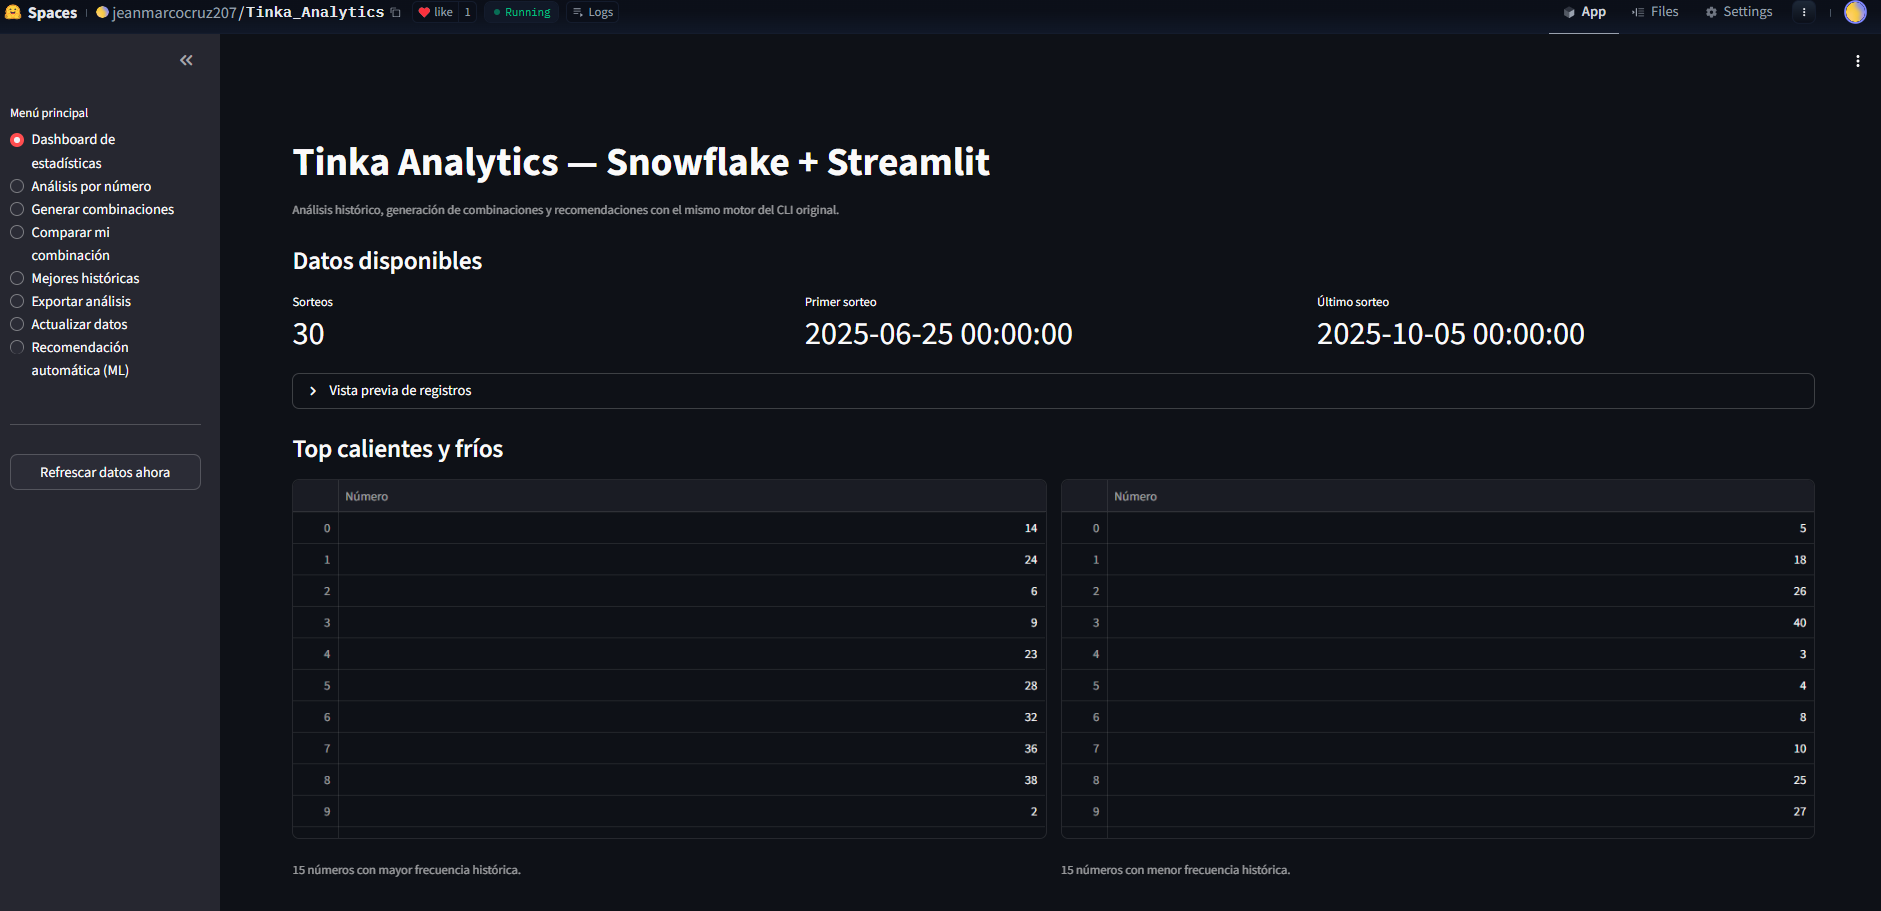
Full-stack application integrating Snowflake as data warehouse, Python for statistical analysis, and Streamlit for interactive visualization. Features historical frequency analysis, optimized combination generator, and ML-powered recommendation engine for pattern prediction.

Real-time control tower that unifies coverage, demand and operational health with predictive alerts per channel.

Shift engine that simulates FT/PT and rest combinations to sustain SLA while protecting team wellbeing.

SARIMA + XGBoost ensemble delivering hourly LTF/STF scenarios with confidence bands for multichannel CX.

Executive dashboard that merges NPS, backlog and capacity to focus squads on the highest-impact fixes.
Background in Communications & Advertising · Data/BI and WFM certifications.
Explore the latest version of my resume right on the site. Print it or save it as a PDF directly from your browser.
Need to strengthen WFM or BI? Let's jump on a short call.